📊 Day 2 - Topic 5: Reporting & Analytics
📈 Module Overview
Data is only valuable when you can extract insights. Siebel provides comprehensive reporting and analytics capabilities to transform your CRM data into actionable business intelligence.
What You'll Learn:
Reporting Tools
- Standard Reports
- Custom Report Creation
- BI Publisher Integration
- Export Capabilities
Analytics & Dashboards
- Real-time Dashboards
- KPI Configuration
- Performance Metrics
- Visualization Options

🏗️ Siebel Reporting Architecture
Reporting Components
• Report Viewer (HTML, PDF, Excel)
• Dashboards and Charts
• Email Delivery
Logic Layer:
• Report Definitions
• Query Builder
• Calculation Engine
• Scheduling Service
Data Layer:
• Siebel Database
• Analytics Database (optional)
• External Data Sources
Report Types
List Reports: Tabular data exports (Accounts, Opportunities, SRs)
Summary Reports: Grouped data with totals and subtotals
Cross-Tab Reports: Pivot table style with rows and columns
Chart Reports: Visual representations (bar, line, pie)
Dashboard Reports: Multiple charts on single page
Form Reports: Detail view of single record (e.g., invoice)
📋 Standard Reports
Out-of-the-Box Reports
Siebel eCommunications includes 200+ pre-built reports ready to use immediately.
Sales Reports
- Pipeline Report: Opportunities by stage and sales rep
- Forecast Report: Revenue forecast by period
- Win/Loss Analysis: Closed opportunities with reasons
- Activity Report: Sales activities by rep and account
- Quota Attainment: Performance vs. targets
Service Reports
- Open SR Report: All open service requests by priority
- SLA Compliance: SLA met vs. breached
- Resolution Time: Average time to resolve by category
- Agent Performance: SRs handled per agent
- Customer Satisfaction: Survey results and CSAT scores
Marketing Reports
- Campaign Performance: Responses, leads, ROI
- Lead Source Analysis: Lead volume by source
- Conversion Funnel: Lead to opportunity to customer
- Email Analytics: Open rates, click rates, unsubscribes
▶️ Running Reports
How to Run a Report
- Navigate to: Site Map → Reports → [Report Category]
- Select desired report from list
- Click Run Report button
- Set parameters (date range, filters, grouping)
- Choose output format (HTML, PDF, Excel, CSV)
- Click OK to generate
- View results in browser or download file
Report Parameters
• Date Range: Last Month, This Quarter, Custom dates
• Owner: Specific user or All users
• Status: Active, Closed, All
• Organization: Filter by business unit
• Product: Filter by product line
• Custom Filters: Account type, revenue range, etc.
Output Formats
HTML
Interactive viewing in browser
✅ Sortable columns, clickable links
Formatted document for printing
✅ Professional appearance, secure
Excel
Spreadsheet for further analysis
✅ Pivot tables, formulas, charts
CSV
Raw data for imports
✅ Lightweight, universal compatibility
🔨 Creating Custom Reports
Report Builder Interface
Siebel's Report Builder provides a wizard-driven interface for creating custom reports without coding.
Report Creation Steps
- Select Data Source: Choose Business Component (e.g., Account, Opportunity)
- Choose Fields: Select columns to include in report
- Add Calculations: Sum, Count, Average, Min, Max
- Set Grouping: Group by owner, region, product, etc.
- Define Sorting: Order results by field(s)
- Apply Filters: Limit records (e.g., Status = Active)
- Format Layout: Headers, footers, fonts, colors
- Save and Test: Name report and run sample
Example: Monthly Sales by Rep
Fields: Owner, Opportunity Name, Revenue, Close Date
Filter: Status = "Closed Won" AND Close Date = This Month
Group By: Owner
Calculations: SUM(Revenue), COUNT(Opportunities)
Sort: Owner ascending
Output:
Rep Name | Opportunities | Total Revenue
Smith, John | 15 | $450,000
Jones, Mary | 12 | $380,000
...
🎓 Advanced Reporting Techniques
Calculated Fields
Create custom calculations within reports:
Average Deal Size: SUM(Revenue) / COUNT(Opportunities)
Win Rate: (COUNT(Closed Won) / COUNT(All Opportunities)) × 100
Days to Close: Close Date - Created Date
Weighted Pipeline: Revenue × Probability
Growth %: ((This Period - Last Period) / Last Period) × 100
Cross-Object Reporting
Pull data from related objects in single report:
Opportunity.Name
Opportunity.Revenue
Account.Name
Account.Industry
Account.Annual Revenue
Primary Contact.Full Name
Primary Contact.Email
Sub-Reports
Embed detail reports within summary reports:
- Parent: Accounts grouped by industry
- Child: For each account, show all opportunities
- Benefit: Comprehensive view in single report
📰 Oracle BI Publisher & Current Query Reporting Architecture
Reporting Architecture: Extraction vs Rendering
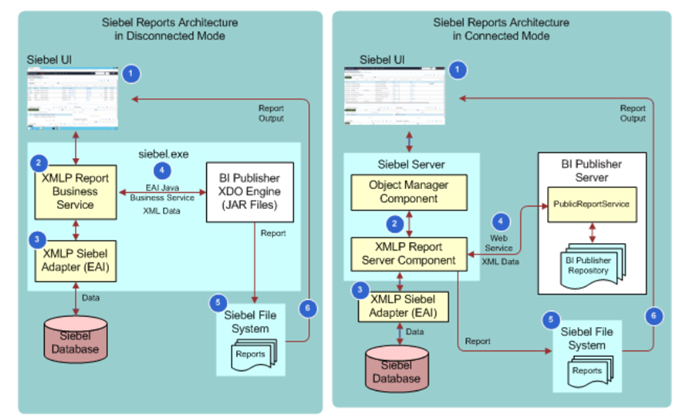
In enterprise Siebel CRM deployments, reporting operates as a two-tier decoupled process:
- Data Extraction Layer (Siebel Object Manager & Integration Objects): Siebel extracts structured CRM records into an XML data payload based on the Current Active Query (PDQ or user filter) and the bound Integration Object (IO).
- Layout & Rendering Layer (BI Publisher): BI Publisher merges the XML data payload with RTF or XSL-FO templates to produce formatted PDF, Excel, or HTML documents. In training and administrative environments without a standalone BIP server cluster, administrators inspect template metadata and IO field mappings directly in the Siebel UI, while operational exports are executed via native CSV/text capabilities.
1. Current Query Reports (Out-of-the-Box Examples)
Current Query reports generate outputs based dynamically on whatever dataset the user is currently viewing in their active applet. The core enterprise examples include:
BIP Accounts - Current Query• cntlist (Contact List): Bound to Integration Object
BIP Contacts - Current Query• oplist (Opportunity List): Bound to Integration Object
BIP Opportunity List - Current Query
2. Integration Object (IO) Search Specifications
Critical Architectural Rule: When generating a report, the records included are determined by the active query filter and the Integration Object's Search Specification, NOT merely by which row is highlighted in the UI.
- If an IO defines a search specification (e.g.,
[Status] = 'Active'), records not satisfying the IO rule will be filtered out even if displayed in the applet. - Selecting a single row and clicking Report will still export all rows matching the active query unless the report definition explicitly specifies single-record form mode.
3. Template & Layout Inspection in Siebel UI
Administrators inspect and configure reporting metadata via Site Map → Administration - BI Publisher Reports → Reports - Templates:
- Template Definitions: Upload, download, and review RTF/XSL-FO template files.
- View Associations: Map report templates to specific screens and views (e.g., associating
aclistwithAccount List View). - Integration Component Fields: Verify which Business Component fields are mapped to XML tags.
4. Operational Reporting & Direct Data Export
For day-to-day analytics, ad-hoc lists, and external auditing without layout rendering overhead, Siebel Open UI provides native Menu → Export:
- Formats: Comma Delimited CSV, Tab-Delimited, HTML, Text.
- Scope: "All Rows in Current Query" exports the complete active dataset with 100% record fidelity.
- Columns: "Visible Columns" exports the exact grid layout customized by the user.
📊 Interactive Dashboards
Dashboard Overview
Dashboards provide at-a-glance views of key metrics with interactive charts and tables. Users can drill down for details.
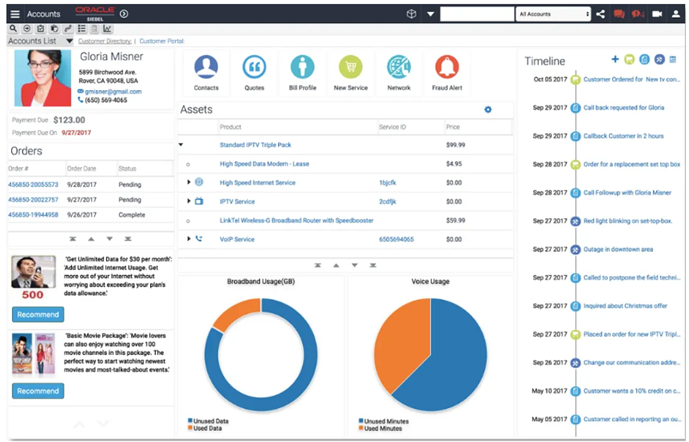
Dashboard Components
Chart Applets
- Bar/Column Charts
- Line/Area Charts
- Pie/Donut Charts
- Gauge Charts
- Funnel Charts
Data Applets
- List Applets
- Form Applets
- KPI Tiles
- Summary Tables
- Trend Indicators
Dashboard Examples
Sales Manager Dashboard:
- Pipeline value by stage (funnel chart)
- Forecast vs. quota (gauge chart)
- Top 10 opportunities (list)
- Win rate trend (line chart)
- Activities this week (KPI tile)
Service Manager Dashboard:
- Open SRs by priority (bar chart)
- SLA compliance % (gauge)
- SRs at risk (list)
- Resolution time trend (line chart)
- Customer satisfaction (KPI tile)
🎯 Key Performance Indicators (KPIs)
What are KPIs?
KPIs are measurable values that demonstrate how effectively an organization is achieving business objectives. Siebel tracks and displays KPIs in real-time.
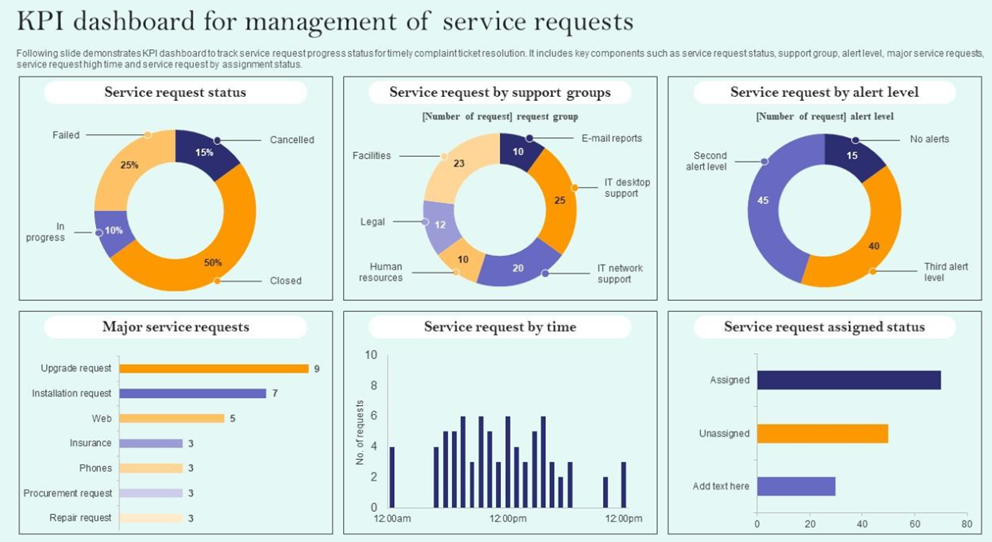
Common CRM KPIs
• Pipeline Value: $12.5M
• Quota Attainment: 95%
• Win Rate: 28%
• Average Deal Size: $45,000
• Sales Cycle: 45 days
Service KPIs:
• Open SRs: 245
• SLA Compliance: 92%
• First Call Resolution: 67%
• Avg Resolution Time: 2.3 days
• CSAT Score: 4.2/5
Marketing KPIs:
• Marketing Qualified Leads: 1,250
• Lead Conversion Rate: 18%
• Campaign ROI: 340%
• Cost per Lead: $45
• Email Open Rate: 23%
KPI Thresholds
Set targets and color-code performance:
🟢 Green: Above target (Good performance)
🟡 Yellow: Near target (Warning - attention needed)
🔴 Red: Below target (Critical - immediate action required)
Configuring KPIs
- Define metric to track (e.g., Quota Attainment)
- Set calculation method (e.g., Revenue ÷ Quota × 100)
- Define thresholds (Green: >100%, Yellow: 80-100%, Red: <80%)
- Set refresh frequency (Real-time, Hourly, Daily)
- Add to dashboards and home pages
⚡ Real-Time Analytics
Live Data Updates
Real-time analytics display current data without manual refresh, critical for contact centers and sales floors.
Real-Time Use Cases
Contact Center Wallboards: Live display of call queue, wait times, agents available
Sales Leaderboards: Current day/week/month rankings update as deals close
Service Metrics: Open SRs, SLAs at risk, backlog by priority
Campaign Tracking: Email open rates, clicks, conversions as they happen
Implementation
• Interval: 30 seconds, 1 minute, 5 minutes
• Trigger: Time-based or event-based
• Scope: Full page or specific applet
• Performance: Balance freshness vs. server load
📉 Data Visualization Best Practices
Choosing the Right Chart Type
Bar/Column Charts: Compare values across categories
Example: Revenue by product line, SRs by priority
Line Charts: Show trends over time
Example: Quarterly revenue growth, daily SR volume
Pie Charts: Show proportional breakdown (use sparingly)
Example: Market share by competitor, SRs by type
Funnel Charts: Visualize conversion process
Example: Sales pipeline stages, lead conversion funnel
Gauge Charts: Show progress toward goal
Example: Quota attainment, SLA compliance %
Visualization Guidelines
- Keep It Simple: Avoid cluttered charts with too many data points
- Use Color Purposefully: Green = good, Red = bad, consistent meanings
- Label Clearly: Axis labels, legends, data point values
- Choose Appropriate Scale: Start Y-axis at zero for fair comparison
- Limit Pie Slices: Maximum 5-7 slices, combine others into "Other"
⏰ Scheduling and Distribution
Automated Report Delivery
Schedule reports to run automatically and email results to recipients. No manual intervention required.
Schedule Configuration
- Open report definition
- Click Schedule button
- Set frequency:
- Daily (weekdays only or every day)
- Weekly (specify days: Mon, Wed, Fri)
- Monthly (1st, 15th, or last day)
- Quarterly
- Set time: 7:00 AM (before business hours)
- Choose output format: PDF, Excel
- Add recipients: email addresses or distribution lists
- Set subject line and message
- Save schedule
Common Scheduled Reports
Weekly: Sales activity summary → Sales VPs
Monthly: Revenue by product → Finance team
Quarterly: Customer satisfaction → Executive team
Example: "Weekly Sales Report - Oct 25-31, 2025"
🔒 Report Security and Access Control
Data Security in Reports
Reports respect Siebel's security model. Users only see data they have permission to access.
Security Layers
- Report Visibility: Which reports appear in user's menu
- Data Visibility: Which records user can see in report
- Field Visibility: Which columns are displayed
- Report Execution: Who can run vs. schedule vs. modify reports
Access Control Examples
• Sees: Own opportunities only
• Cannot see: Colleague opportunities or manager overrides
Sales Manager:
• Sees: Own team's opportunities
• Cannot see: Other teams' opportunities
Sales VP:
• Sees: All opportunities in region
• Cannot see: Other regions without permission
Sensitive Data Protection
- Mask credit card numbers (show last 4 digits only)
- Redact social security numbers
- Hide salary and compensation data
- Restrict access to financial reports
- Audit report execution (who ran what, when)
📤 Data Export Capabilities
Export Options
Users can export data from any list applet for offline analysis or data migration.
Export Methods
Quick Export
Right-click list → Export → Excel/CSV
✅ Fast, simple, current view
❌ Limited to displayed columns
Advanced Export
File → Export → Choose columns
✅ Select specific fields
✅ Include hidden columns
Excel Export Features
- Formatted Output: Headers, column widths preserved
- Data Types: Dates, numbers, text maintained
- Formulas: Can add calculations in Excel
- Pivot Tables: Create custom analysis
- Charts: Visualize exported data
CSV Export Benefits
Lightweight: Smaller file size than Excel
Universal: Opens in any spreadsheet program
Import Ready: Clean format for re-importing
Database Compatible: Easy to load into SQL databases
⚡ Report Performance Optimization
Slow Report Issues
Complex reports with large datasets can take minutes to run. Optimization is critical for user satisfaction.
Performance Bottlenecks
- Large Data Volume: Millions of records
- Complex Joins: Multiple related tables
- Missing Indexes: Slow search fields
- Calculations: Heavy processing in report
- Concurrent Users: Many reports running simultaneously
Optimization Techniques
- Add Indexes: Index frequently queried fields
- Limit Date Range: Default to last 90 days instead of all time
- Use Parameters: Let users filter to relevant subset
- Pre-Aggregate Data: Create summary tables for dashboards
- Schedule Heavy Reports: Run overnight instead of on-demand
- Cache Results: Reuse recent report output
- Pagination: Display 100 rows at a time, not 10,000
Performance Targets
Acceptable: 3-10 seconds
Slow: 10-30 seconds (needs optimization)
Very Slow: > 30 seconds (requires immediate attention)
📊 Analytics Database (Optional)
Separate Analytics Environment
Large enterprises often implement a separate analytics database to offload reporting from the production Siebel database.
Benefits of Analytics DB
- Performance: Reports don't slow down operational system
- Historical Data: Keep years of data for trending
- Complex Queries: Run heavy analytics without impact
- Data Warehouse Integration: Combine CRM with ERP, finance, etc.
- BI Tools: Connect Tableau, Power BI, MicroStrategy
Data Synchronization
Extract: Pull data from Siebel (nightly)
Transform: Clean, aggregate, denormalize
Load: Insert into analytics database
Typical Schedule:
• Incremental: Every hour (recent changes)
• Full Refresh: Nightly (complete dataset)
• Historical: Weekly (archive old data)
🎨 Report Customization
Branding and Styling
Customize report appearance to match corporate identity.
Customization Options
- Company Logo: Add header logo to all reports
- Color Scheme: Match corporate colors
- Fonts: Use company standard fonts
- Headers/Footers: Add company info, page numbers, dates
- Watermarks: "Confidential", "Draft", etc.
Template Example (BI Publisher)
[Company Logo] | SALES OPPORTUNITY REPORT
Run Date: {CurrentDate} | Page {PageNumber}
Body:
[Report Data Table]
Footer:
Confidential - For Internal Use Only
© 2025 YourCompany Inc.
Conditional Formatting
Highlight Rules:
- Revenue > $100K: Bold, blue font
- Probability < 25%: Red background
- Close Date overdue: Yellow highlight
- Status = "Closed Won": Green checkmark icon
📈 Trend Analysis
Historical Trending
Compare current performance against historical data to identify patterns and anomalies.
Trend Report Examples
Revenue Trend: Monthly revenue for last 12 months
Pipeline Trend: Pipeline value at end of each quarter
SR Volume Trend: Daily SR creation count for last 90 days
Win Rate Trend: Quarterly win rate percentage
Year-over-Year Comparison
Revenue: $12.5M vs $10.2M (+23%)
Deals Closed: 145 vs 132 (+10%)
Win Rate: 32% vs 28% (+4 pts)
Avg Deal Size: $86K vs $77K (+12%)
Identifying Trends
✅ Positive Trends: Growing pipeline, improving win rates, faster resolution times
⚠️ Negative Trends: Declining revenue, longer sales cycles, increasing SLA breaches
📊 Seasonality: Expected patterns (Q4 spike, summer slowdown)
🔍 Drill-Down Analysis
Interactive Drill-Down
Click summary data to see underlying details. Essential for investigating issues and opportunities.
Drill-Down Levels
↓ (Click to drill down)
Level 2: By Region: North $20M, South $18M, West $12M
↓ (Click South)
Level 3: By Rep in South: Smith $6M, Jones $5M, Brown $4M...
↓ (Click Smith)
Level 4: Individual Opportunities for Smith
Common Drill-Down Paths
- Geographic: Company → Region → Territory → Rep → Account
- Product: Total → Product Line → Product → SKU → Customer
- Time: Year → Quarter → Month → Week → Day
- Organizational: Company → Division → Department → Team → Individual
📋 Report Governance
Managing Report Sprawl
Without governance, organizations end up with hundreds of redundant, outdated reports that confuse users.
Best Practices
- Naming Standards: Clear, consistent names (e.g., "SLS_Pipeline_ByRep_Monthly")
- Categorization: Organize into folders (Sales, Service, Marketing, Executive)
- Ownership: Assign owner responsible for maintenance
- Documentation: Describe purpose, data source, refresh frequency
- Version Control: Track changes, maintain change log
- Retirement: Archive unused reports annually
Report Catalog
Maintain central catalog documenting all reports:
Category: Sales / Management
Owner: Sales Operations Manager
Purpose: Track pipeline health and forecast accuracy
Data Source: Opportunity BC
Refresh: Real-time
Recipients: Sales VPs, Directors
Schedule: None (on-demand)
Last Modified: 2025-09-15
Usage: 45 runs/month
🎓 Advanced Analytics
Predictive Analytics
Use historical data and machine learning to predict future outcomes.
Predictive Use Cases
Lead Scoring: Predict which leads are most likely to convert
Churn Prediction: Identify customers at risk of canceling
Upsell Opportunities: Recommend next best product for customer
Forecast Accuracy: Improve revenue predictions with AI
Service Demand: Predict SR volume for staffing
Integration with Oracle Analytics Cloud
Siebel CRM → Data Lake → Analytics Cloud → ML Models
↓
Predictions back to Siebel
Example: Opportunity Score
ML model analyzes historical won/lost opportunities to score new opportunities:
High Score (80-100): Strong engagement, right timing, good fit
Medium Score (50-79): Some positive signals, needs nurturing
Low Score (0-49): Weak indicators, low probability
📊 Industry-Specific Analytics
Telecommunications KPIs
eCommunications vertical includes telco-specific metrics.
Subscriber Metrics
- Total Subscribers: Active customer count
- Net Adds: New activations - Cancellations
- Churn Rate: % of customers who cancel per month
- ARPU: Average Revenue Per User per month
- Lifetime Value: Predicted total revenue from customer
Network Performance
- Network Availability: Uptime percentage (target: 99.9%)
- Outage Count: Number of service disruptions
- MTTR: Mean Time To Repair (average outage duration)
- Coverage Map: Geographic service availability
Service Quality
• Dropped Call Rate: 0.5%
• Call Setup Success: 99.2%
• Voice Quality (MOS): 4.1/5.0
Data Performance:
• Avg Download Speed: 85 Mbps
• Avg Upload Speed: 35 Mbps
• Latency: 22ms
• Packet Loss: 0.2%
🔒 Data Privacy and Compliance
Regulatory Requirements
Reports containing personal data must comply with privacy regulations.
GDPR Compliance
- Data Minimization: Only export necessary fields
- Retention: Don't store exported reports longer than needed
- Anonymization: Mask PII when possible
- Consent: Verify customer consent for data processing
- Audit Trail: Log who accessed what personal data
- Right to Erasure: Reports must reflect deleted customer data
Data Masking Example
Name: John Smith
Email: john.smith@email.com
Phone: (555) 123-4567
SSN: 123-45-6789
Credit Card: 4532-1234-5678-9012
Masked Data (Standard user):
Name: John S****
Email: j***@email.com
Phone: (555) ***-**67
SSN: ***-**-6789
Credit Card: ****-****-****-9012
Compliance Reporting
Generate reports for regulatory compliance:
- Data access audit (who viewed customer records)
- Consent status report
- Data retention compliance
- Breach notification logs
🎯 Report ROI and Adoption
Measuring Report Value
Track report usage to understand which reports provide value and which to retire.
Usage Metrics
Run Frequency: How often report is executed
Unique Users: Number of distinct users running report
Avg Execution Time: Performance indicator
Export Rate: % of runs that are exported (high = valuable)
Dashboard Placement: Featured on home pages?
Adoption Strategies
- Training: Show users how to run and interpret reports
- Templates: Provide pre-built reports for common needs
- Self-Service: Empower users to create own reports
- Mobile Access: Enable reports on smartphones/tablets
- Alerts: Push critical metrics to users proactively
- Gamification: Leaderboards for sales teams
Report Retirement Criteria
• No runs in last 90 days
• < 3 unique users
• Owner left company
• Duplicate of another report
• Data source no longer exists
• Regulatory requirement expired
📱 Mobile Reporting
Reports on Mobile Devices
Modern CRM users need access to reports on smartphones and tablets while traveling or away from desk.
Mobile-Optimized Design
- Responsive Layout: Adapts to screen size
- Touch-Friendly: Large buttons, easy navigation
- Simplified Views: Key metrics only, not cluttered
- Offline Capable: Download reports for offline viewing
- Fast Loading: Minimize data transfer
Mobile Dashboard Example
Sales Manager Mobile View:
- Today's Activities: 5 (tap to see details)
- Open Opportunities: $2.4M
- Pipeline This Quarter: $8.1M
- Team Quota Attainment: 87%
- [Chart: Revenue Trend - Last 30 Days]
🔧 Troubleshooting Reports
Common Report Issues
Problem: Report shows no data
Solutions:
- Check user has access to underlying records
- Verify filter criteria isn't too restrictive
- Confirm data exists for selected date range
- Review visibility rules and team assignments
Problem: Numbers don't match expectations
Solutions:
- Verify report definition (correct fields, calculations)
- Check for timezone issues with date/time fields
- Confirm currency conversion if multi-currency
- Review filter logic (AND vs OR conditions)
- Ensure latest data has synced (refresh analytics DB)
Problem: Report times out or errors
Solutions:
- Add date filter to limit records
- Optimize query (add indexes, simplify joins)
- Increase timeout setting
- Schedule during off-hours instead of real-time
- Break into smaller sub-reports
✅ Reporting Best Practices Summary
Design Principles
- Know Your Audience: Executive summary vs analyst detail
- Start with Questions: What decisions will this report support?
- Keep It Simple: One primary message per report
- Use Visuals: Charts communicate faster than tables
- Provide Context: Include comparisons, targets, trends
- Enable Action: Reports should drive decisions
- Test Thoroughly: Validate accuracy before distribution
Performance Guidelines
- Target report runtime: < 5 seconds for interactive, < 30 seconds for batch
- Limit row count: 1,000 rows for screen, 10,000 for export
- Index search fields used in filters
- Cache frequently accessed data
- Use analytics database for heavy reporting
Security Reminders
- Apply row-level security (users see only their data)
- Mask sensitive fields (SSN, credit cards)
- Audit report execution
- Encrypt emailed reports
- Set appropriate export limits
🚀 Future of Siebel Reporting
Emerging Trends
Oracle continues to enhance Siebel analytics with modern capabilities.
AI-Powered Insights
Natural Language Queries: "Show me open opportunities in California over $50K"
Anomaly Detection: Automatic alerts when metrics deviate from normal patterns
Smart Recommendations: "Your win rate dropped 5% in Q2. Drill down to see why."
Predictive Alerts: "This opportunity is at risk of slipping based on similar patterns"
Enhanced Visualization
- Interactive Maps: Geographic heat maps of sales, service, customers
- Network Diagrams: Relationship visualization (accounts, contacts, influencers)
- Sankey Diagrams: Flow visualization (lead sources to conversions)
- Real-Time Collaboration: Shared dashboards with team annotations
Cloud Analytics Integration
Deeper integration with Oracle Analytics Cloud (OAC) provides:
- Advanced data science capabilities
- Augmented analytics (AI-driven insights)
- Data storytelling and presentations
- Mobile-first design
- Collaboration features
📖 Additional Resources
Oracle Documentation
- Siebel Analytics Guide
- BI Publisher Administrator's Guide
- Siebel Reports Administration Guide
- Oracle Analytics Cloud documentation
Training and Certification
- Oracle University: Siebel Analytics courses
- BI Publisher training
- Data visualization best practices
- SQL query optimization
Community Resources
- Oracle Cloud Customer Connect forums
- Siebel Hub blog
- Data visualization galleries (inspiration)
- Industry benchmarking reports
🎉 Reporting Module Complete!
Key Takeaways
- ✅ Standard Reports: Leverage 200+ out-of-box reports
- ✅ Custom Reports: Build tailored reports for unique needs
- ✅ Dashboards: Real-time KPIs and visualizations
- ✅ BI Publisher: Professional formatted documents
- ✅ Scheduling: Automate report delivery
- ✅ Security: Protect sensitive data
- ✅ Performance: Optimize for speed
- ✅ Mobile: Access insights anywhere
What's Next?
You've completed all Day 2 theory modules. This afternoon, you'll apply these concepts in hands-on practical exercises:
Day 2 Practicals Preview:
- Lab 1: Create custom sales report with grouping and calculations
- Lab 2: Build interactive dashboard with multiple chart types
- Lab 3: Configure scheduled report delivery
- Lab 4: Generate BI Publisher invoice template
🌟 Congratulations!
You've completed the Oracle Siebel CRM theoretical training. You now have comprehensive knowledge of:
- CRM fundamentals and Siebel architecture
- Configuration and customization
- Data management and quality
- Advanced sales, service, and marketing features
- Integration and mobile capabilities
- Reporting and analytics
Continue to Day 2 Practicals to apply your knowledge!